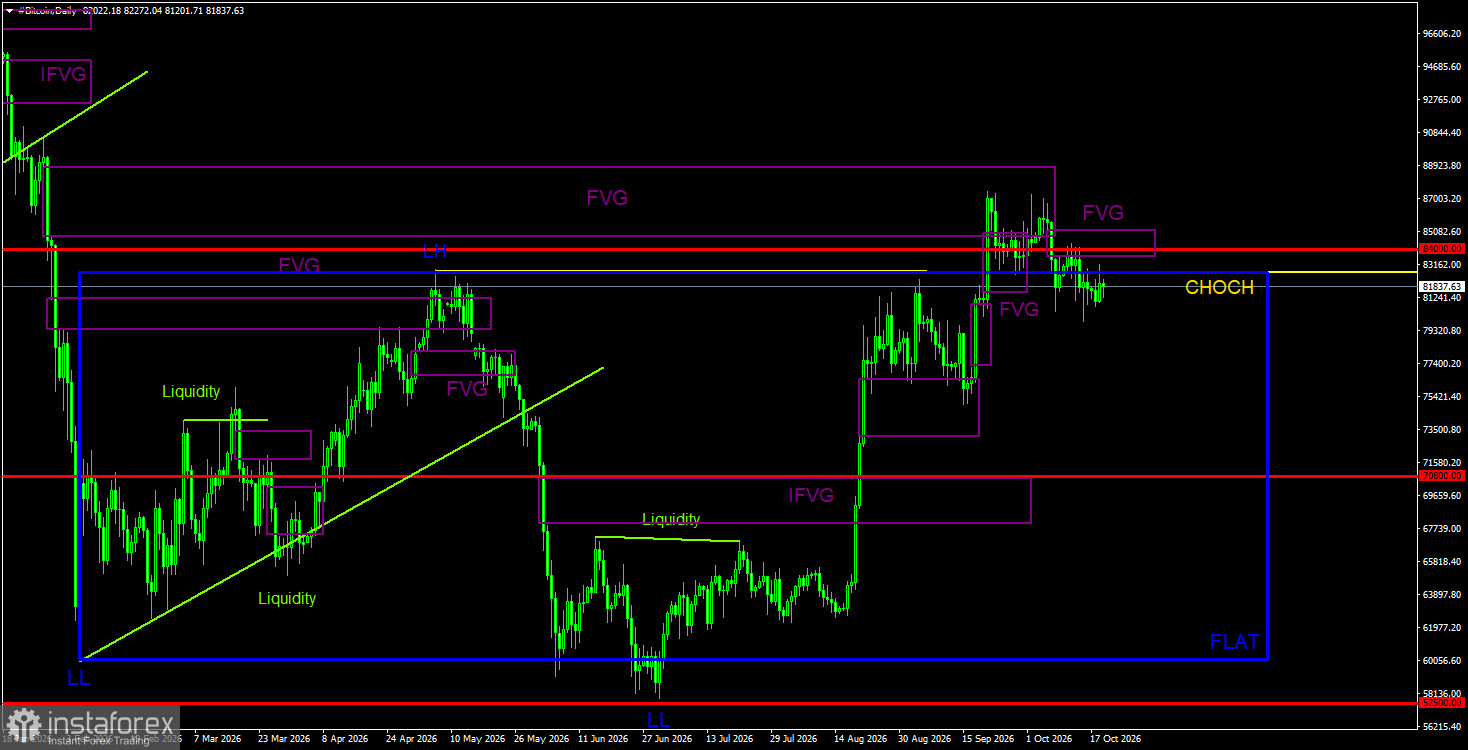
Bitcoin, after two weeks of stagnation, has finally begun to fall, but the decline is very weak so far. A correction is underway, and it may take a long time. Recall that the probability that the downtrend has ended is real and not small. However, the reasons for a new sustained bull trend remain ambiguous and debatable. The recent three-month rise in Bitcoin was essentially a move from the lower edge of the daily sideways channel to the upper edge after a deviation formed at the channel's lower boundary and a deviation formed at the upper boundary. The upper-boundary deviation was deep, but if it is indeed a deviation, Bitcoin may head for $70,800 in the near term. After that, the price would likely remain flat again, and its prospects would remain uncertain.
Meanwhile, well-known Michael Saylor gave another interview explaining Bitcoin's recent weakness. The former CEO of Strategy, who always urges everyone to buy Bitcoin (and who personally benefits from its appreciation), said that rising US Treasury yields and the AI sector have pulled some capital away from crypto. Treasury yields have been elevated for several months, and AI has drawn capital globally for over a year. It's unclear why those flows should stop and why all freed capital should flow into Bitcoin.
Saylor also said Bitcoin will continue to rise and generate average annual gains of 20–30% if governments allow lending secured by "digital gold." If banks are permitted to conduct operations using Bitcoin without excessively large reserve requirements, that could create billions in credit money and materially boost crypto market capitalization. However, there are currently no signs that Bitcoin is being reclassified as a "low-risk" asset, which would reduce its reserve requirement from the current 100%. Right now, it is unprofitable for banks to deal with Bitcoin because it requires very large reserves.
Overall BTC/USD picture on 1D
On the daily timeframe, the bearish trend structure has been broken, so most likely "digital gold" has officially moved into forming a new bull trend. Price worked out the bearish FVG from the prior trend, reacted to it, and a correction began as expected. A breakout beyond the $60,000–$82,500 sideways channel could still be a deviation which, combined with the reaction to the bearish FVG, may provoke a drop back toward the channel's lower edge. That gave traders grounds to open short positions. A new bearish FVG also formed, adding another sell signal.
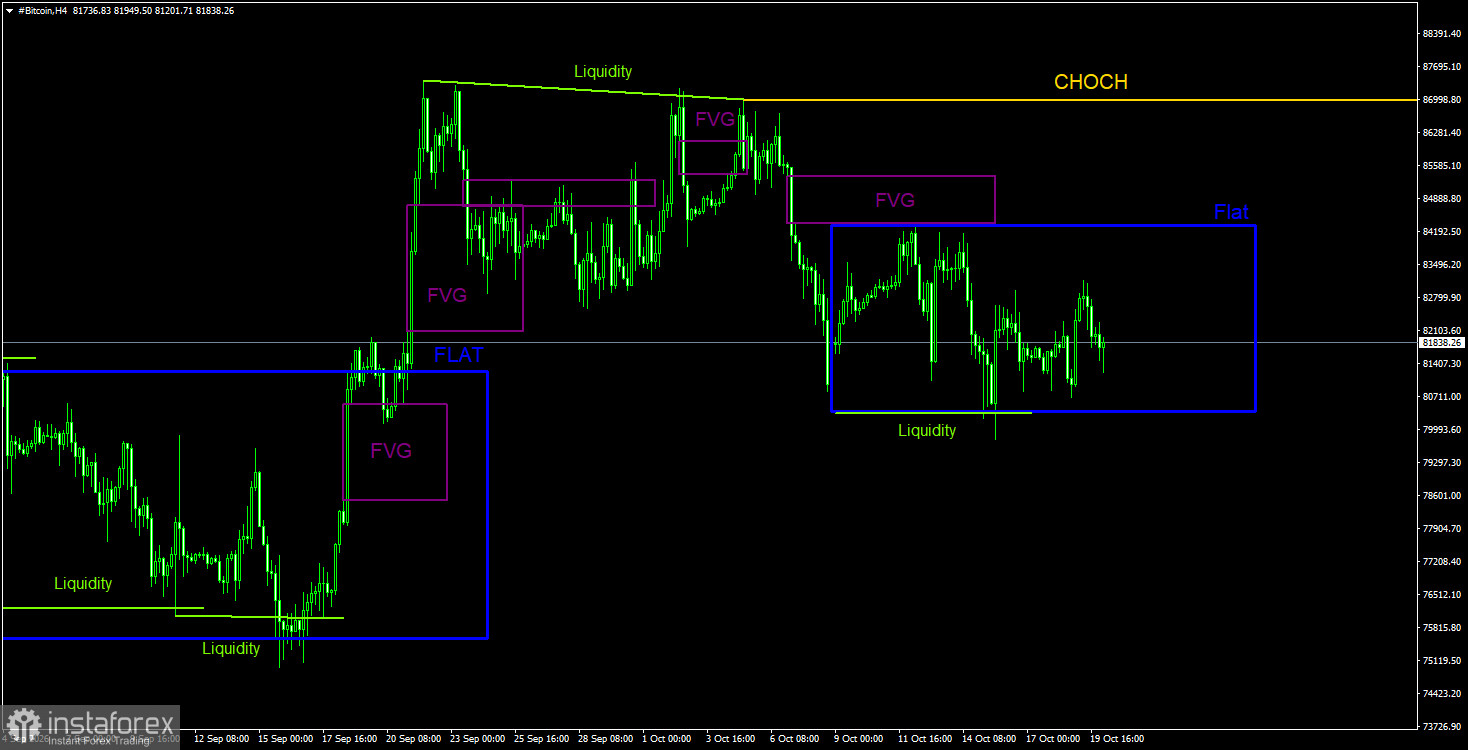
Overall BTC/USD picture on 4H
On the 4-hour timeframe, a bearish structure has started to form. The CHOCH line currently sits near $87,000. On the daily timeframe, all necessary downward reversal signals have formed, allowing traders to open short positions. Bitcoin's targets are best defined by the daily-chart sideways channel, which we still view as relevant. On the 4-hour chart, the last bearish FVG triggered a price reaction that caused a new decline in the primary cryptocurrency. The only worry now is another flat and the removal of buy liquidity at the previous low. Bitcoin may spend some time inside the $80,400–$84,300 range.
Trading recommendations for BTC/USD
Bitcoin shows signs of the start of a new bull trend. As often happens, this trend begins with a pump without clear, concrete reasons. The Federal Reserve has not begun easing, and the Clarity Act bill was not passed. In the near term, on the daily timeframe, Bitcoin may still be declining, since price reacted to the bearish FVG and formed two sell signals. Also note that a breakout beyond the daily sideways channel could be a deviation — a deep deviation, but still a deviation. If that happens, Bitcoin could head toward $70,800 and even maintain the downtrend that began last year. We believe short positions are most relevant in the near term. On the 4-hour timeframe, watch the upper boundary of the sideways channel—a deviation could form there and renew the decline.
Explanations for the illustrations:
CHOCH — Change of Character: a break in trend structure.
Liquidity — Liquidity: stop-losses and pending orders that market-makers use to accumulate positions.
FVG — Fair-Value Gap: a price-inefficiency zone. Price moves quickly through such areas, indicating one side is absent from the market. Subsequently, price often returns and reacts to these areas, continuing the main trend.
IFVG — Inverted Fair-Value Gap: after returning to such a zone, price does not react there but impulsively breaks through it and then tests it from the other side.
OB — Order Block: a candle where a market-maker opened a position with the intent to take liquidity and then establish a position in the opposite direction.