Analysis of Friday's Trades:
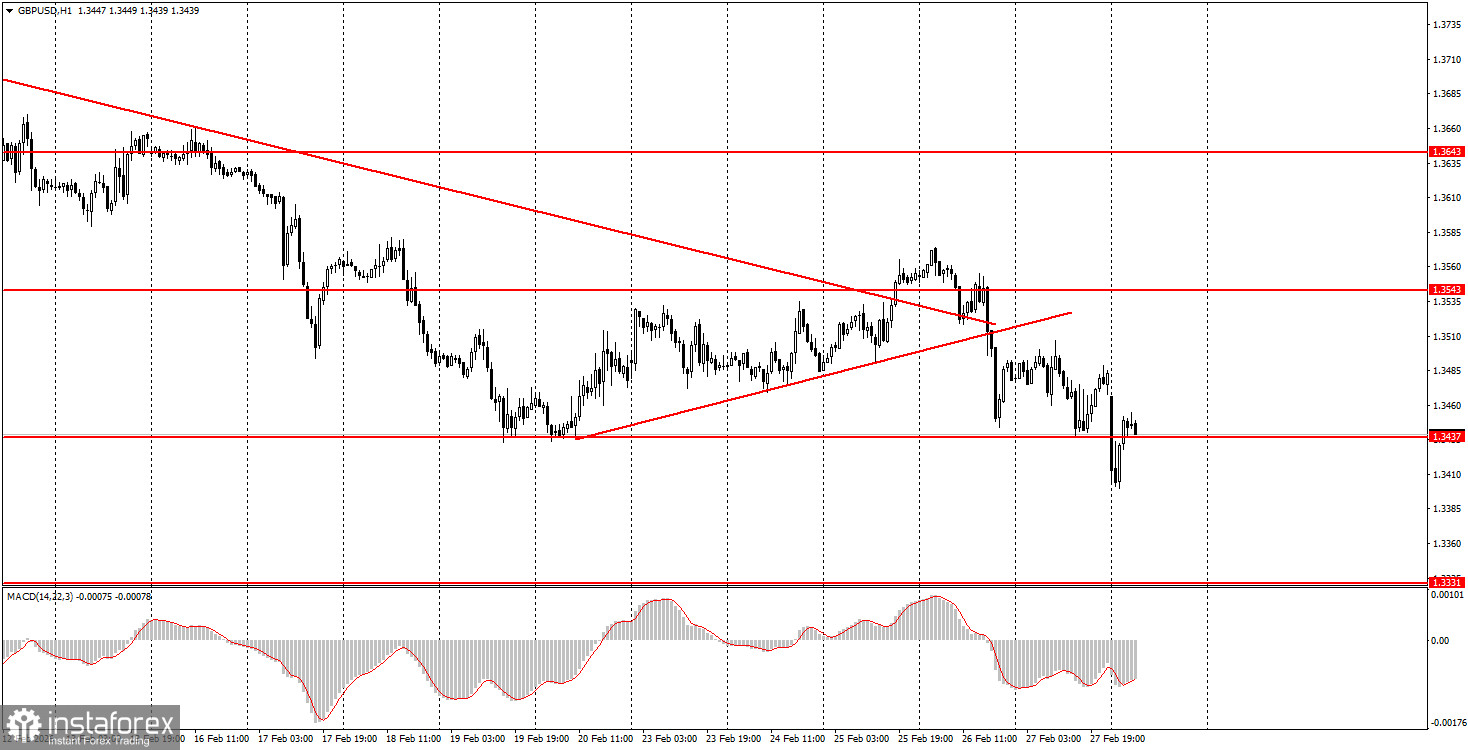
1H Chart of the GBP/USD Pair
The GBP/USD pair declined to 1.3437 for the fourth time on Friday and broke below it on Monday night. Thus, the upward trend ended before it even began. The market began paying closer attention to the dollar late last week as the situation in the Middle East escalated. Negotiations in Geneva on Thursday between Iran and the US failed, and at that moment, it became clear that war in Iran was only a matter of time. Military actions began on Saturday, but the market only reacted on Monday. Therefore, the new week began with a rise in the US currency, and the British pound once again became a hostage to circumstances. Regarding macroeconomic events, only the Producer Price Index (PPI) was published in the US last Friday. For the second month in a row, the PPI came in higher than expected, significantly reducing the likelihood of a new Fed rate cut in the coming months.
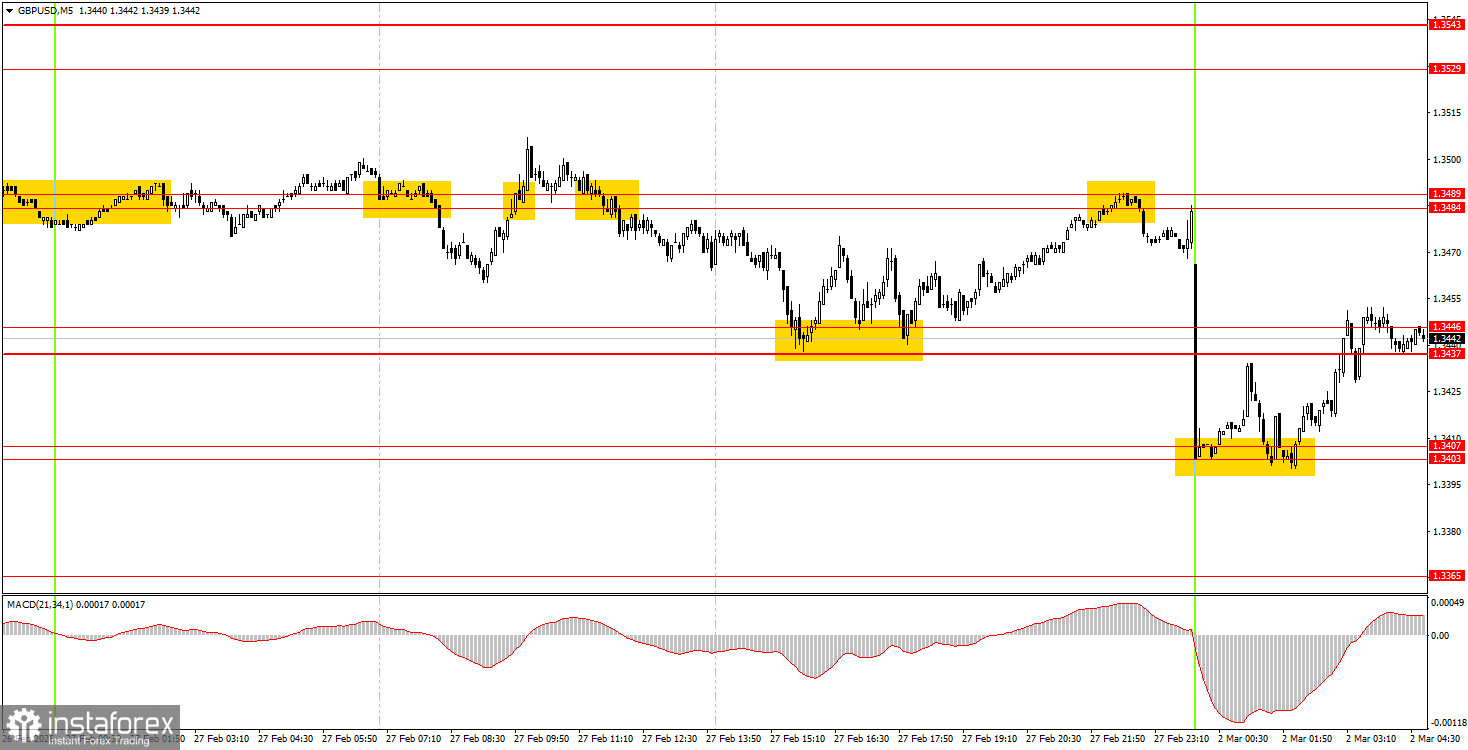
5M Chart of the GBP/USD Pair
On the 5-minute timeframe, many signals were generated on Friday, but not all were accurate and valid. During the European trading session, three signals formed, two of which proved false. As a result, novice traders could incur losses on two trades, and the third signal should not have been acted upon. During the American trading session, the price bounced three times from the area of 1.3437-1.3446, allowing traders to open long positions, and by the end of the day, the pair reached the nearest target of 1.3484-1.3489. Thus, the morning losses were mitigated. Last night, the price bounced twice from the 1.3403-1.3407 area and got stuck in the 1.3437-1.3446 area.
How to Trade on Monday:
On the hourly timeframe, the GBP/USD pair broke the downward trend and then immediately broke the new upward one. There are no global grounds for medium-term dollar growth, so we expect the continuation of the global upward trend from 2025, which could push the pair to 1.4000 at a minimum. In recent weeks, the situation has often not favored the British currency, while the market has frequently ignored negative news from the US, allowing the US currency to rise.
On Monday, novice traders can open long positions if the price breaks through the area of 1.3437-1.3446, targeting 1.3484-1.3489. A price consolidation below the 1.3437-1.3446 area will allow for short positions targeting 1.3403-1.3407.
On the 5-minute timeframe, trading can currently be done at the following levels: 1.3319-1.3331, 1.3365, 1.3403-1.3407, 1.3437-1.3446, 1.3484-1.3489, 1.3529-1.3543, 1.3643-1.3652, 1.3695, 1.3741-1.3751, 1.3814-1.3832, 1.3891-1.3912, and 1.3975. On Monday, no significant events are scheduled in the UK, while the US will publish an important ISM index for the manufacturing sector.
Key Principles of the Trading System:
- The strength of a signal is determined by the time it takes to form the signal (bounce or breakout). The less time taken, the stronger the signal.
- If two or more trades have been opened at a particular level based on false signals, all subsequent signals from that level should be ignored.
- In a flat market, any pair can form many false signals or none at all. In any case, at the first signs of a flat trend, it is best to stop trading.
- Trading deals are to be opened during the period between the start of the European session and the mid-American session, after which all trades should be closed manually.
- On the hourly timeframe, it is preferable to trade based on signals from the MACD indicator only when there is good volatility and a trend confirmed by a trend line or trend channel.
- If two levels are positioned too close together (5-20 pips apart), they should be considered a support or resistance area.
- Upon moving 20 pips in the correct direction, a Stop Loss should be set to breakeven.
What to Look for on the Charts:
Price levels of support and resistance are levels that serve as targets when opening buys or sells. Take Profit levels can be placed around them.
Red lines represent channels or trend lines that show the current trend and indicate the direction in which it is preferable to trade now.
The MACD indicator (14,22,3) – the histogram and the signal line – is a supporting indicator that can also be used as a source of signals.
Important speeches and reports (always included in the news calendar) can significantly affect the movement of the currency pair. Therefore, during their release, trading should be done with utmost caution, or traders should exit the market to avoid sharp price reversals against the previous movement.
Beginning traders in the forex market should remember that not every trade can be profitable. Developing a clear strategy and effective money management are the keys to long-term trading success.