Analysis of Friday's Trades
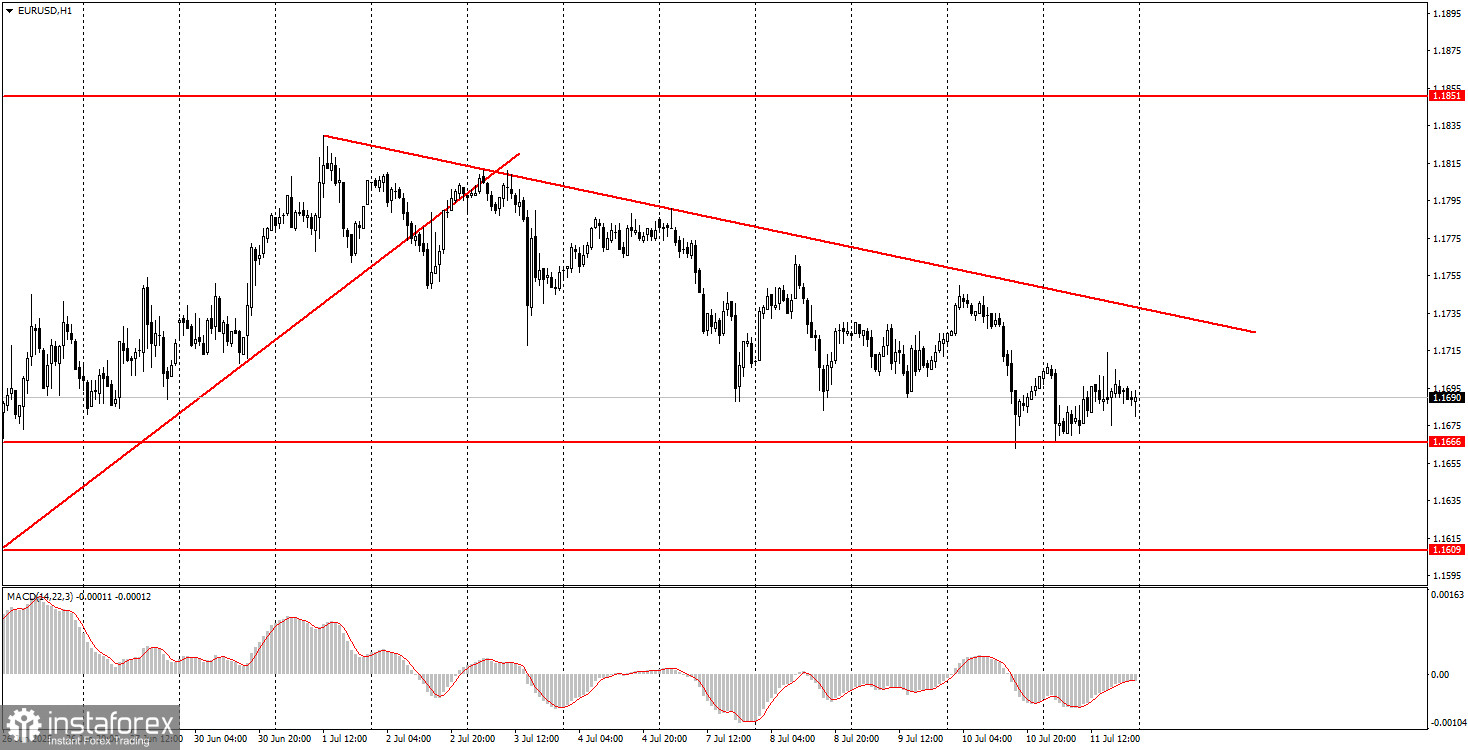
1H Chart of EUR/USD
On Friday, the EUR/USD currency pair continued its mild downward movement, in line with the current trend. We've been saying the same thing all week, because practically nothing has changed in the market. The pair has been gradually sliding down each day, with no macroeconomic background to influence it, while fundamental events—mainly related to the global trade war—discourage traders from buying the dollar. To be fair, no one is buying the dollar at this time. The EUR/USD pair has been correcting for a full two weeks, but during that time, it has only declined by about 150 points, not enough to talk about a "dollar trend." Moreover, the so-called "Devil's Level" has not been broken, and there are no grounds for continued dollar strength. Even this past week, the dollar could have easily dropped every single day. However, technicals have prevailed over fundamentals, since even the dollar cannot fall continuously under current circumstances.
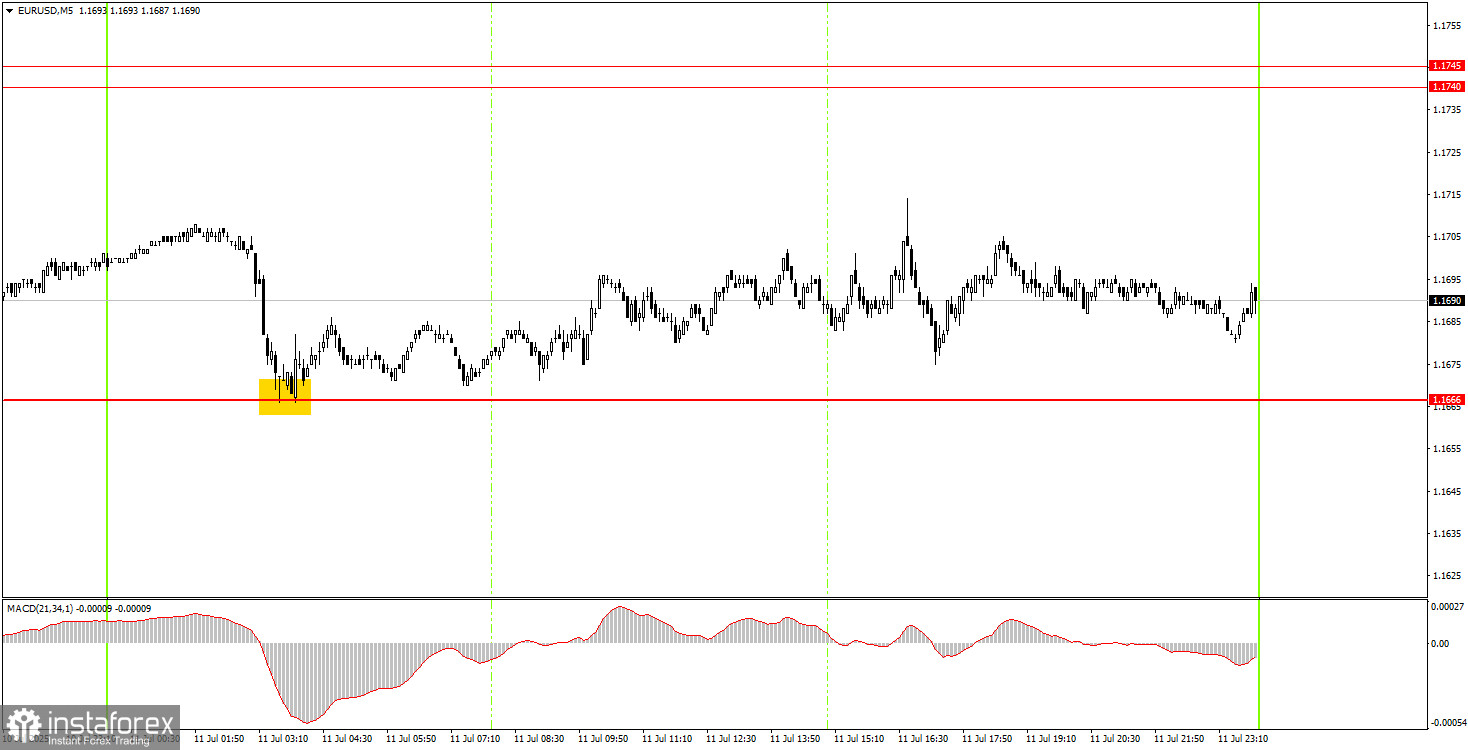
5M Chart of EUR/USD
On the 5-minute timeframe, Friday was marked by a nearly flat market all day, with overall daily volatility at just 49 points. Essentially, the only trading signal was formed at night, when the price once again bounced off the 1.1666 level. After that, it managed to rise about 40–50 points, and no other signals were generated. Thus, novice traders could have opened a long position at the start of the European session and closed it anywhere during the American session. In any case, the trade would have been profitable.
Trading Strategy for Monday:
On the hourly timeframe, the EUR/USD pair continues its correction, but the five-month uptrend remains unaffected. The fact that Donald Trump is still President of the United States is more than enough to keep the U.S. dollar under pressure. The dollar (like any other currency or instrument) must undergo occasional corrections, which is precisely what we're seeing now. However, given the overall fundamental background, expecting a strong rally from the dollar remains extremely difficult. A break of the trendline would signal the end of the correction.
On Monday, the EUR/USD pair may again attempt to overcome the relatively strong 1.1666 level, but two prior bounces off this level indicate a potential rise, at least to the trendline. A firm break below 1.1666 would signal the continuation of the local downward trend.
On the 5-minute chart, the relevant levels to watch are: 1.1198–1.1218, 1.1267–1.1292, 1.1354–1.1363, 1.1413, 1.1455–1.1474, 1.1527, 1.1561–1.1571, 1.1609, 1.1666, 1.1740–1.1745, 1.1808, 1.1851, 1.1908.
On Monday, there are once again no interesting or important events scheduled in either the Eurozone or the United States. This makes it the sixth consecutive day. Thus, today, all hopes are once again pinned on Trump. Last week, the market completely ignored all of Trump's new tariffs, which casts serious doubt on the market's ability to break above the 1.1666 level.
Core Trading System Rules:
- Signal Strength: The shorter the time it takes for a signal to form (a rebound or breakout), the stronger the signal.
- False Signals: If two or more trades near a level result in false signals, subsequent signals from that level should be ignored.
- Flat Markets: In flat conditions, pairs may generate many false signals or none at all. It's better to stop trading at the first signs of a flat market.
- Trading Hours: Open trades between the start of the European session and the middle of the US session, then manually close all trades.
- MACD Signals: On the hourly timeframe, trade MACD signals only during periods of good volatility and a clear trend confirmed by trendlines or trend channels.
- Close Levels: If two levels are too close (5–20 pips apart), treat them as a support or resistance zone.
- Stop Loss: Set a Stop Loss to breakeven after the price moves 15 pips in the desired direction.
Key Chart Elements:
Support and Resistance Levels: These are target levels for opening or closing positions and can also serve as points for placing Take Profit orders.
Red Lines: Channels or trendlines indicating the current trend and the preferred direction for trading.
MACD Indicator (14,22,3): A histogram and signal line used as a supplementary source of trading signals.
Important Events and Reports: Found in the economic calendar, these can heavily influence price movements. Exercise caution or exit the market during their release to avoid sharp reversals.
Forex trading beginners should remember that not every trade will be profitable. Developing a clear strategy and practicing proper money management are essential for long-term trading success.